DigitALL Agency
Channel Platform
A fragmented, data-blind legacy dashboard used by 300+ insurance agents — redesigned into a priority-first, data-driven hub that transformed how agents navigate their daily workload.
300+ agents starting each day without a clear direction
DigitALL is Allianz Turkey's internal B2B platform used exclusively by insurance agents to manage their full portfolio — policies, customers, performance targets, sales opportunities, and rewards. I was the sole designer on this platform with full ownership across research, design, and stakeholder alignment.
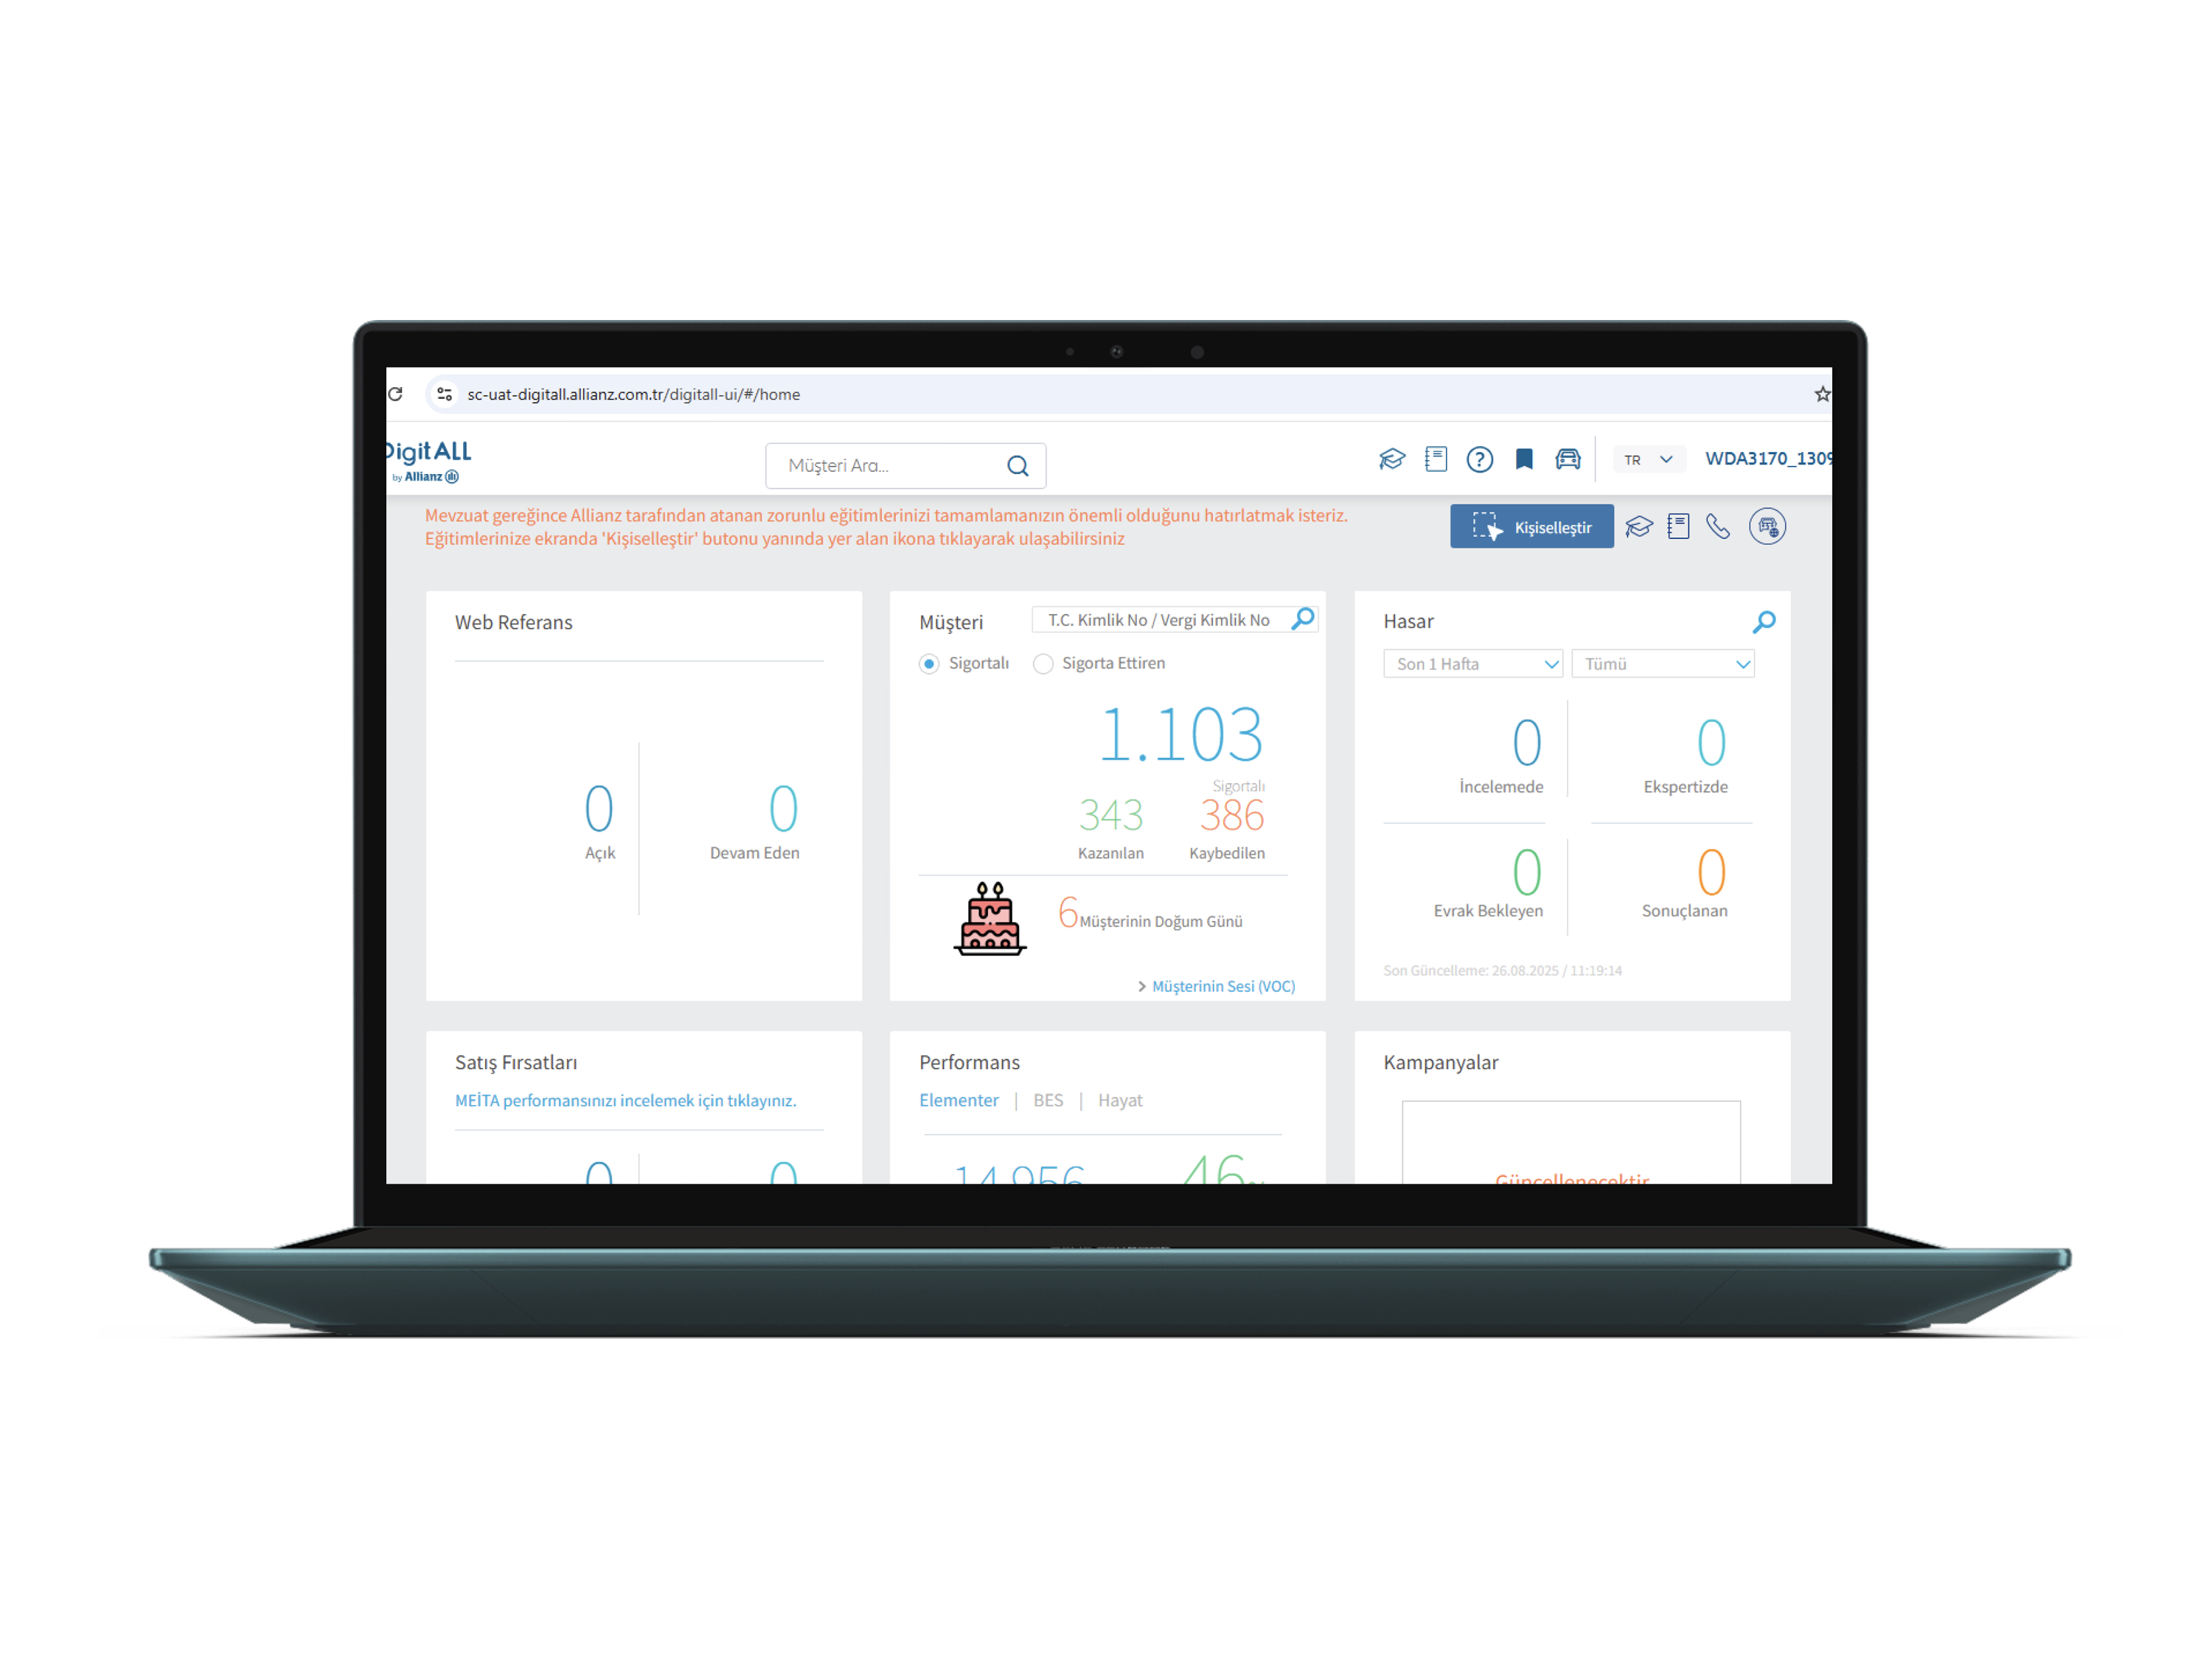
When I joined, the homepage dashboard was a collection of 6 equal-weight tiles — Web Referans, Müşteri, Hasar, Satış Fırsatları, Performans, Kampanyalar — arranged with no visual hierarchy, no prioritization logic, and no way to understand at a glance what actually needed attention that day.
Design Constraints
- Power users, but time is scarce in agent workflows
- Existing backend data structure maintained — no new data sources
- Parallel development sprints — design shipped incrementally
- Multiple profiles: high-volume veterans vs. onboarding agents
Scope of Impact
- 300+ insurance agents as daily active users
- Primary operational tool — no workarounds available
- Agent KPIs directly tied to management performance reviews
- Mobile gap identified during research → fed into strategic roadmap
Listening to agents — finding the real friction points
Before any wireframes, I ran structured interviews and contextual observation sessions with a cross-section of agents — from high-volume veterans managing 500+ policies to newly onboarded agents navigating the platform for the first time. The goal: understand what the first 5 minutes of their workday actually looked like, and where the legacy dashboard was failing them.
I need to check 3 separate widgets just to understand my sales situation. By the time I've pieced it together, I've already lost 10 minutes. On a busy day, that matters.
Senior Insurance Agent — 8+ years on the platform- No way to see priority tasks without clicking through multiple tiles
- Performance percentage conveyed nothing without a target visual
- Renewal alerts mixed with birthday notifications — no urgency differentiation
- Cross-sell opportunities not linked to customer profiles
- Dashboard felt overwhelming — "too much, all at once"
- No mobile access — agents couldn't check status while with clients
- Agents needed a "what do I do TODAY" section at the top — always
- Visual KPI rings would replace mental math with instant clarity
- Group items by urgency level — action items vs. informational
- Ödül Programları was motivational — agents wanted it visible, not buried
- Announcements needed to be prominent but non-blocking
- Mobile coverage is a critical strategic gap — escalated to roadmap
From complexity to clarity — a priority-first dashboard
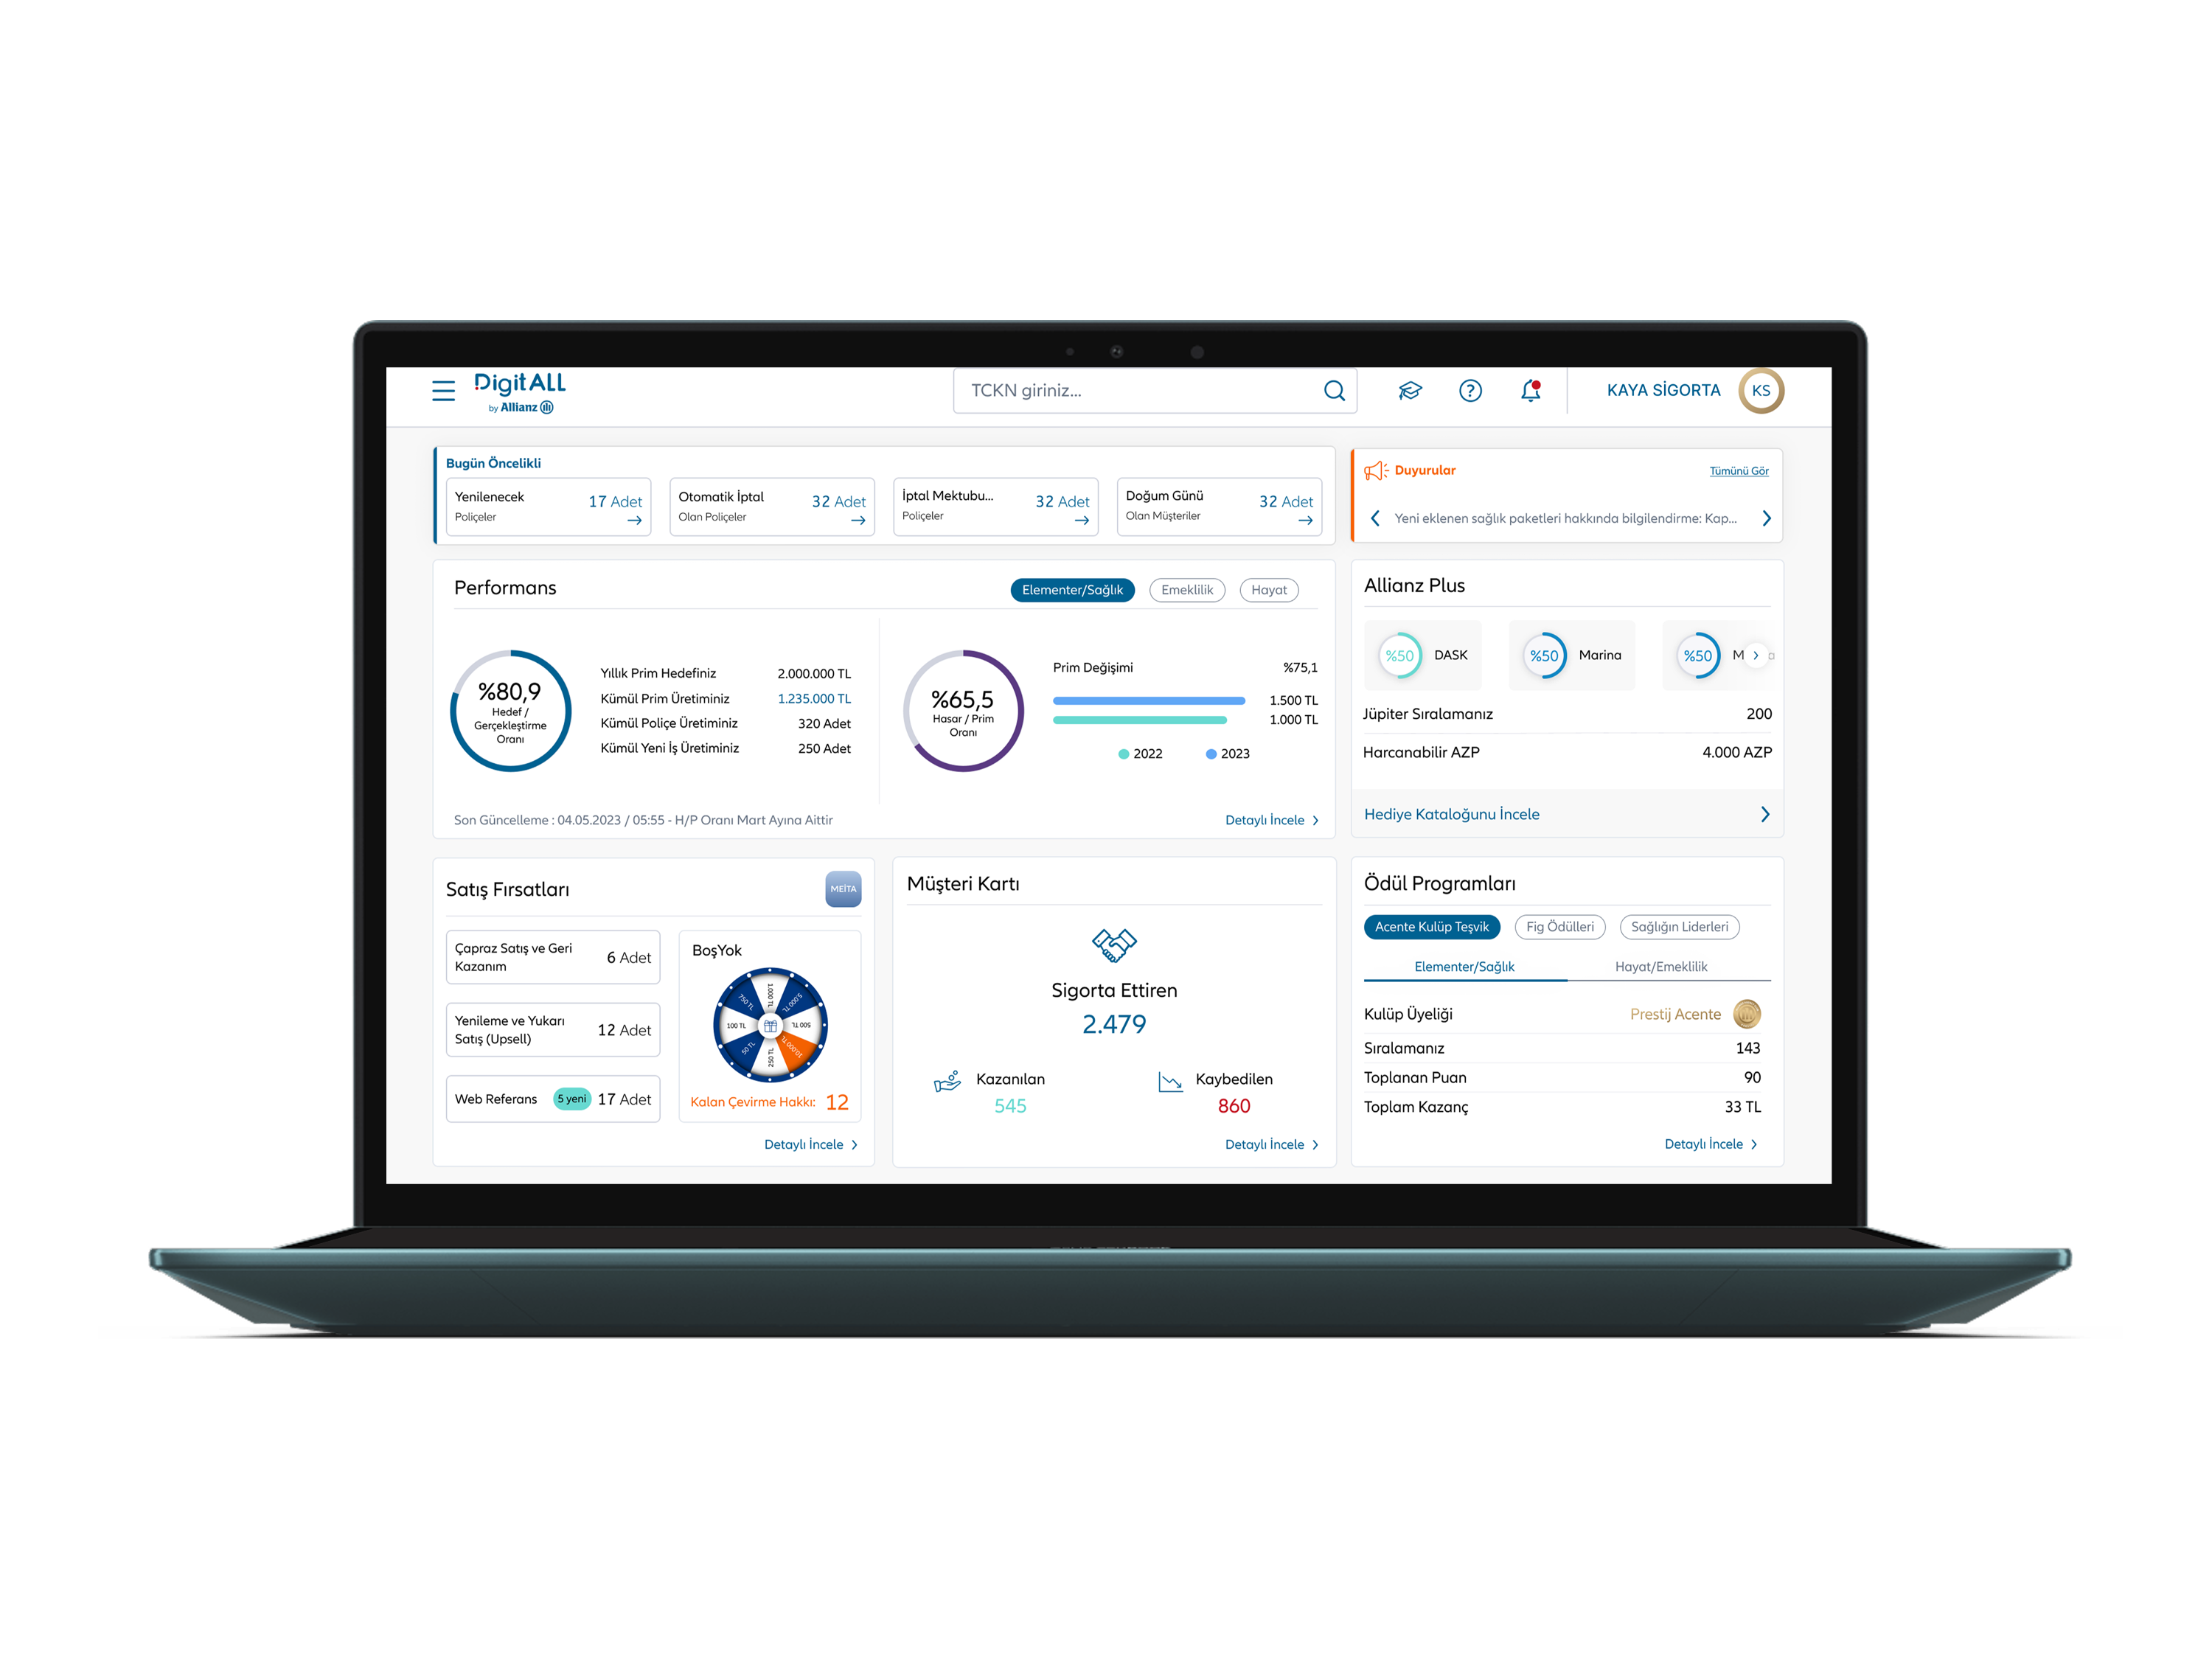
Rather than rearranging the same tiles, I restructured the entire information architecture around a single question: what does an agent need to act on first? The redesigned dashboard answers that within 3 seconds of opening the platform.
The new layout is built on three layers: Today's Priorities (immediate actions required), Performance Context (how am I tracking against targets), and Opportunities & Rewards (what else should I leverage). Each layer has a clear visual identity, allowing agents to scan vertically and jump to what they need instantly.
From agent frustration to a shipped dashboard
Equal tiles to a priority-first layout
The same data. The same agents. A completely different experience — driven entirely by information architecture, visual hierarchy, and the decision to design around agent workflows rather than data availability.
What changed after shipping
The redesign was measured through post-launch agent surveys, prototype testing time-on-task benchmarks, and qualitative feedback gathered over 6 weeks post-release. Results validated the core hypothesis: hierarchy drives efficiency, even for power users who know a platform well.
What I'd do differently
What worked well
Starting with research and refusing to touch the UI until I understood the actual workflow proved critical. The 3-layer hierarchy wasn't a design preference — it came directly from observing how agents processed information. The mobile gap identification was also a significant outcome that went beyond the original brief.
What I'd approach differently
With more time, I would have pushed for a longitudinal study — measuring dashboard engagement patterns over several months rather than relying on snapshot surveys. I'd also have designed personalisation options for the widget grid, since veteran agents and onboarding agents have meaningfully different priority needs.